Every IFRS S2 report contains three emissions numbers. They look like three versions of the same thing and they are not. Each rests on a different kind of evidence, and one of them contains a requirement most first-cycle reports get slightly wrong.
Key points
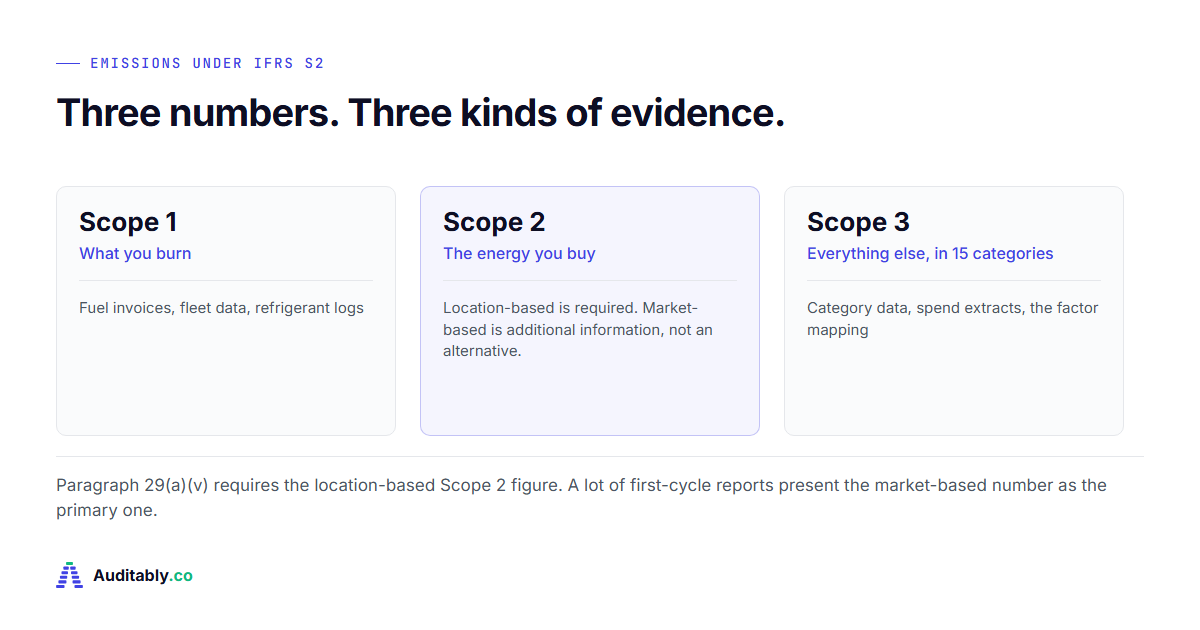
- Scope 1 is what you burn. Scope 2 is the energy you buy. Scope 3 is everything else in your value chain, in fifteen categories.
- Paragraph 29(a)(v) requires the location-based Scope 2 figure. The market-based figure is additional information, not an alternative.
- All three are disclosed gross, in tonnes of CO2 equivalent, measured under the GHG Protocol Corporate Standard unless your jurisdiction requires otherwise.
Scope 1: direct emissions
Emissions from sources you own or control. Fuel burned in your boilers and furnaces, your vehicle fleet, and any process emissions from what you manufacture. Refrigerant leakage counts, and it is the line most often missed entirely in a first cycle.
Scope 1 is usually the easiest to evidence because the source documents already exist somewhere in finance. Fuel invoices, fleet card statements, meter readings. The work is less about measurement and more about boundary: which entities and which sites are inside the figure, and whether that matches the consolidation used in your financial statements.
Scope 2: the requirement people misread
Scope 2 is the indirect emissions from the electricity, steam, heating and cooling you purchase. There are two accepted ways to calculate it and IFRS S2 does not treat them as equivalent.
Scroll the table sideways on a phone →
| Location-based | Market-based |
|---|---|
| Required by paragraph 29(a)(v) | Additional information you may give |
| Uses the average emissions intensity of the grid you draw from | Reflects contractual instruments you hold, such as renewable certificates or power purchase agreements |
| Evidence: consumption data, the period it covers, and the grid factor version applied | Evidence: the contracts themselves, each attributable to your consumption, in your market, for your reporting period, and claimed by nobody else |
The distinction matters because the two figures are evidenced completely differently. A location-based number rests on consumption and a published factor. A market-based number rests on a contract file that has to be maintained to the same standard as the number itself, and in a first cycle that file is usually thinner than the calculation.
Paragraph 29(a)(v) also asks for information about the contractual instruments you hold, where that information helps a reader understand your Scope 2 position. A large gap between your two figures is a question you should expect rather than a problem in itself. The answer is your contract file.
Scope 3: the fifteen categories
Scope 3 covers indirect emissions across your value chain, upstream and downstream. The GHG Protocol splits it into fifteen categories, and IFRS S2 asks you to state which of them are included in your figure.
You are not expected to have all fifteen. Most companies are material in three or four. What matters is that the categories you included are named, and that the ones you left out were left out for a stated reason rather than by accident.
Scope 3 also carries a first-period transition relief, so it can wait one reporting period. Using that relief and saying so is a complete disclosure. Omitting Scope 3 silently is not.
Measurement, factors and the conversion
Measurement follows the GHG Protocol Corporate Accounting and Reporting Standard, unless a jurisdictional authority or the exchange you are listed on requires a different method, in whole or in part.
The seven greenhouse gases are converted into CO2 equivalent using global warming potential values on a 100-year time horizon, from the latest IPCC assessment available at your reporting date. The December 2025 amendments added a jurisdictional relief here too: where a regulator or your exchange requires different GWP values, you may use those.
The phrase latest available at the reporting date does more work than it looks. It means your answer can change between cycles. If a new assessment lands, next year may not use the values this year used, and your trend will shift for a reason that has nothing to do with your operations. The thing to keep on file is not the number. It is which version you used and when that was decided.
A worked example: one Scope 1 figure, end to end
A single site burning natural gas. This is what the figure looks like from source document to signed disclosure, and it is worth walking through because almost every emissions number has this shape.
Scroll the table sideways on a phone →
| Step | What happens | What it leaves behind |
|---|---|---|
| Source | The gas invoice arrives for the period | The invoice itself, filed with the date received and who received it |
| Extract | Consumption is read off the invoice, 48,200 cubic metres | A note of which line on which invoice, so a second person can find it |
| Convert | Volume converted to energy, then to CO2 equivalent using the published factor | The factor, its publisher, and its version |
| Calculate | The arithmetic is performed | A working saved where somebody other than the preparer can open it |
| Review | A second person checks the figure against the invoice | A name and a date, and that person is not the preparer |
| Approve | The figure is approved for inclusion | A line in a record, rather than a nod in a meeting |
Six steps, none of them difficult on the day. The two that get skipped are the last two, because they require a decision about process rather than a piece of data. They are also the two an assurance provider asks about first, because they are what separates a figure that was checked from a figure that was produced.
Then in March the supplier reissues the invoice with a corrected meter read, and the number you approved in September is wrong. That is ordinary and it is not a failure. What matters is whether the correction leaves a record. Write down the reason, the old value, the new value, the evidence and the person, and re-approve. Overwrite the cell instead and your disclosure becomes accurate and undefendable at the same time.
The mistakes that recur
Five that show up repeatedly in first cycles, in rough order of how often.
Scroll the table sideways on a phone →
| The mistake | Why it matters |
|---|---|
| Presenting market-based Scope 2 as the primary figure | Paragraph 29(a)(v) requires the location-based number. The market-based one is additional information. |
| A reporting boundary that does not match the financial consolidation | Defensible if explained, and confusing if not. State the difference and the reason for it. |
| Refrigerant leakage omitted from Scope 1 | It is an in-scope direct emission and it is the line most often forgotten entirely. |
| A factor with no recorded version | The number cannot be reproduced later, which turns a checked figure into an unverified one. |
| Scope 3 categories listed without saying why others were excluded | A reader cannot tell whether an absent category was a judgement or an oversight. |
None of these are measurement errors. They are all recording or presentation decisions, which is why they survive into a published report and then surface in review.
What an assurance provider asks about emissions
The questions are more predictable than people expect, and they are about process rather than arithmetic.
- Show me the source document behind this figure
- Which entities and sites does this cover, and which does it not
- Which factor did you apply, and which version of it
- Who prepared this, who reviewed it, and on what date
- Has it changed since it was first produced, and if so why
- How did you conclude the excluded Scope 3 categories were not material
A figure that answers all six inside an hour is defensible. A figure that fails one of them is not wrong, it is unverified, and the difference matters a great deal when somebody outside is forming a view.
What each figure has to be able to show
The same six things sit behind all three scopes, and the last two are where first cycles thin out.
- The source document in the form it arrived
- The boundary: which entities and sites are in, and which are not
- The method, the factor and the factor version
- The calculation, in a form a second person can follow
- A review by somebody who is not the preparer, with a date
- The change history if the figure moved after it was first produced
A figure that survives those six is defensible. A figure that fails one of them is not wrong, it is unverified, and the difference matters a great deal when somebody outside is forming a view on your report.
Common questions
Does IFRS S2 require both Scope 2 figures?
No. Paragraph 29(a)(v) requires the location-based figure. The market-based figure is additional information you may disclose, and it becomes relevant when you hold contractual instruments. Reporting both is common and reasonable, but it is not what the standard requires, and a report that presents the market-based number as the primary figure has it the wrong way round.
Can I leave out Scope 3 in my first year?
Yes. There is a transition relief for Scope 3 in the first annual reporting period. The obligation returns in the second, so treat the first year as the time to build the process rather than the time to ignore it.
Which Scope 3 categories do I have to report?
The ones that are material to you, and you state which categories are included in your measure. Most companies are material in a handful. The December 2025 amendments also allow an entity to limit Category 15 to financed emissions, with an explanation of what was excluded.
What emission factors should I use?
IFRS S2 does not publish a factor set. It points to the GHG Protocol for measurement, and requires 100-year GWP values from the latest IPCC assessment available at your reporting date for the conversion to CO2 equivalent, subject to jurisdictional relief. Record which factor version you used and when you chose it, because that is the question you will be asked.