Scope 3 is the largest part of most emissions inventories and the least well evidenced. The fifteen categories are not equally relevant to anyone, and knowing which ones apply to you is most of the work.
Key points
- Fifteen categories, eight upstream and seven downstream, defined by the GHG Protocol rather than by IFRS S2.
- IFRS S2 asks you to state which categories are included in your Scope 3 figure.
- Category 15 changed in December 2025: it may be limited to financed emissions, with an explanation of what was excluded.
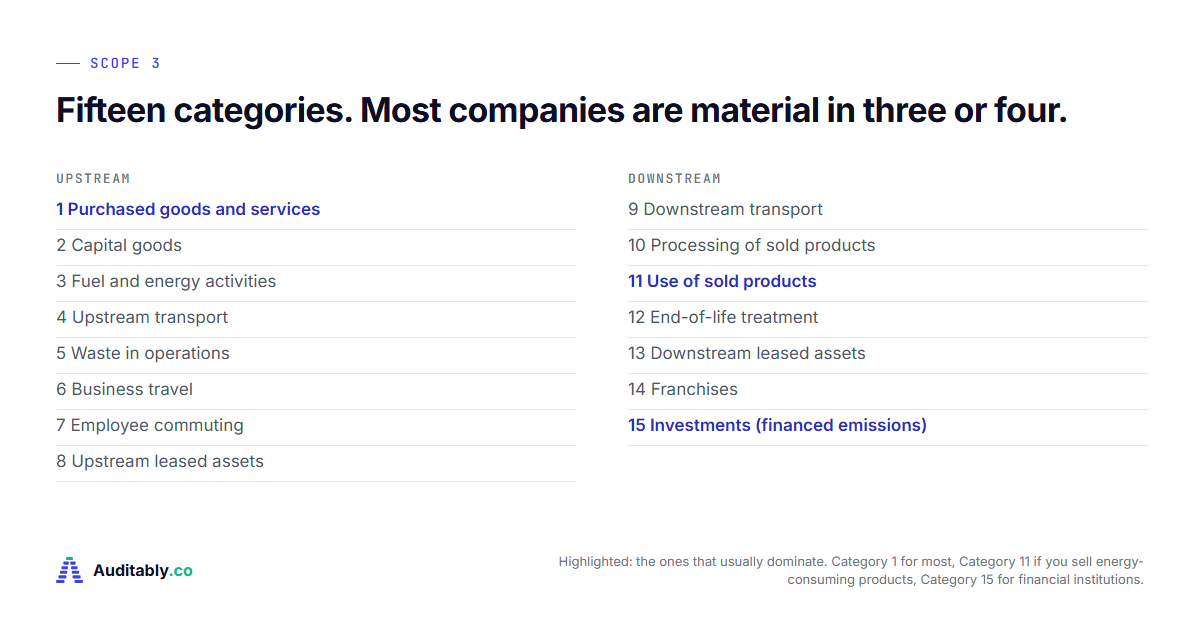
Upstream: categories 1 to 8
Scroll the table sideways on a phone →
| # | Category | Usually material to |
|---|---|---|
| 1 | Purchased goods and services | Almost everyone. Usually the largest single category. |
| 2 | Capital goods | Asset-heavy businesses in a build phase. |
| 3 | Fuel and energy related activities not in Scope 1 or 2 | Energy-intensive operations. |
| 4 | Upstream transportation and distribution | Retail, manufacturing, distribution. |
| 5 | Waste generated in operations | Manufacturing, hospitality. |
| 6 | Business travel | Professional services. Easy to evidence. |
| 7 | Employee commuting | Large-headcount employers. |
| 8 | Upstream leased assets | Businesses leasing in space or equipment. |
Category 1 is where the effort goes and where the evidence is weakest. Most first cycles calculate it from spend data and an average factor, which is accepted practice and also the thing an assurance provider will want to understand. Record the spend extract, the factor set and the version, and the mapping between your expense categories and the factors.
Downstream: categories 9 to 15
Scroll the table sideways on a phone →
| # | Category | Usually material to |
|---|---|---|
| 9 | Downstream transportation and distribution | Manufacturers and distributors. |
| 10 | Processing of sold products | Intermediate goods producers. |
| 11 | Use of sold products | Anyone selling something that consumes energy. Often the largest category by far. |
| 12 | End-of-life treatment of sold products | Consumer goods, packaging. |
| 13 | Downstream leased assets | Lessors and property owners. |
| 14 | Franchises | Franchisors. |
| 15 | Investments | Banks, insurers and asset managers. This is financed emissions. |
Category 11 deserves attention if you sell anything that uses energy in operation. For many manufacturers it dwarfs everything else in the inventory, and the assumptions behind it, expected lifetime and usage pattern, are judgements that need to be written down when they are made.
Category 15 and the December 2025 amendment
For a bank, insurer or asset manager, Category 15 is the number that matters and the hardest one to produce. The ISSB amended it in December 2025, effective for annual reporting periods beginning on or after 1 January 2027, with early application permitted.
Paragraph 29A now permits you to limit what you include in Category 15 to financed emissions only, meaning emissions attributed to loans and investments made to investees or counterparties. Loans and investments covers loans, project finance, bonds, equity investments and undrawn loan commitments, and for asset managers it includes assets under management. Derivatives may be excluded.
That is the relief. Two things follow from using it. Paragraph 29B requires you to explain what you treated as a derivative and describe the financial activities you excluded. Paragraph 29C requires that if Category 15 sits inside your Scope 3 figure, you disclose the total Category 15 number and the financed emissions subtotal within it.
The measurement gets smaller and the explanation gets longer. That is the pattern across all four of the December 2025 amendments.
How to run a screening estimate
Before measuring anything properly, estimate everything roughly. The point is to find out which categories carry the weight, and it usually takes a day rather than a quarter.
Scroll the table sideways on a phone →
| Step | What to do |
|---|---|
| 1. Pull the data you already have | A spend extract by expense category, headcount, business travel bookings, and any logistics or waste volumes. |
| 2. Apply any reasonable factor | A published spend-based set is fine at this stage. You are ranking categories, not reporting them. |
| 3. Rank the result | Sort by estimated tonnes. Most inventories show three or four categories carrying the large majority of the total. |
| 4. Record the conclusion | Which categories you will measure properly, which you will not, and the reasoning for each. |
The fourth step is the one that gets skipped and the one that matters. The question you will be asked is not why Category 9 is small. It is how you concluded Category 9 was not material, and that is a different question with a documentary answer.
Evidencing Category 1, which is where the effort goes
Purchased goods and services is the largest category for most businesses and the one with the weakest evidence in a first cycle. Almost everyone calculates it from spend data and an average factor, which is accepted practice and also the thing a reviewer will want to understand.
- The spend extract itself, with the period and the ledger it came from
- The factor set, its publisher and its version
- The mapping between your expense categories and the factors applied to them
- Any categories of spend excluded, and why
- Who built the mapping and who reviewed it
The mapping is the part that carries the judgement. Two companies with identical spend can report materially different Category 1 figures purely because of how expense lines were matched to factors, and that is a legitimate difference provided the mapping is written down.
A practical note. Spend-based factors move with price as well as with activity, so a year of cost inflation can raise your Category 1 figure while your actual purchasing falls. If your total moves for that reason, say so in the narrative rather than leaving a reader to infer an operational change that did not happen.
Category 11, and the assumptions inside it
Use of sold products deserves separate attention if you sell anything that consumes energy in operation. For many manufacturers it is larger than every other category combined, and it rests almost entirely on assumptions rather than on measured data.
Three assumptions do the work: the expected lifetime of the product, the usage pattern over that lifetime, and the energy intensity of the environment it is used in. Change any one of them and the figure moves substantially.
Which is why the assumptions matter more than the total. Record them when they are set, with whatever they were based on, and disclose them alongside the number. A large Category 11 figure with stated assumptions is a complete disclosure. The same figure with no assumptions stated is a number nobody can interpret, including you, next year.
How to decide which categories apply
Do a screening estimate before you do a measurement. Rough out every category using spend or activity data and whatever factor is to hand, rank them, and you will usually find three or four carry almost all of the total. Those are the ones to evidence properly.
Write the screening down. The question you will be asked is not why Category 9 is small. It is how you concluded Category 9 was not material, and that is a different question with a documentary answer.
Categories you exclude should be excluded for a stated reason. A list of included categories with no explanation of the absent ones invites the reader to assume the omission was an oversight.
Common questions
Do I have to report all 15 Scope 3 categories?
No. You report the categories that are material to you, and you state which categories are included in your Scope 3 measure. Most companies are material in three or four. What matters is that the exclusions were a decision you can explain rather than a gap.
Which Scope 3 category is usually the biggest?
Category 1, purchased goods and services, for most businesses. For anyone selling energy-consuming products it is often Category 11, use of sold products. For financial institutions it is Category 15.
What are financed emissions?
The emissions attributed to loans and investments a financial institution makes to its counterparties and investees. They sit inside Category 15. Since the December 2025 amendment an entity may limit Category 15 to financed emissions only, provided it explains what it excluded.
Can I use spend-based factors for Scope 3?
Yes, and most first cycles do for Category 1. It is accepted practice. Keep the spend extract, the factor set with its version, and the mapping between your expense categories and the factors, because the method is what gets questioned rather than the total.